Atrial Fibrillation (AF)
Atrial fibrillation is the most common non-sinus arrhythmia. It is characterized by an irregularly irregular rhythm and fibrillation waves on the baseline.

The hallmark of Atrial Fibrillation is irregularity, both an irregular rhythm and irregular atrial electrical activity. AF comes from an atrial origin, but not a sinus origin, so there will be no P Waves and the baseline will show fibrillation of the atria. Since the fibrillation of the atria is the origin of the electrical activity, randomly activating the AV Node, the complex below the atria (QRS-T) remains as described in the prototypical Normal Sinus Rhythm.
Once a tracing is identified as having an irregularly irregular rhythm, fibrillation waves, and QRS-T complexes without P waves, it can be called Atrial Fibrillation. An Atrial Fibrillation EKG is:
An EKG tracing with an irregular rhythm of normal QRS-T complexes and fibrillation of the baseline.
Defining Characteristics* of AF in Lead II
- Rate: N/A (See Rates of AF below.)
- Rhythm: Irregularly Irregular | Random R-R Intervals.
- P Waves: Not present. (Non-sinus origin.)
- P-R Intervals: N/A
- QRS Complexes: Maximum 0.12sec (3mm) [3 small boxes].
- Q-T Intervals†: Approx. 0.42sec (10.5mm) [10.5 small boxes].
- T Waves: Amplitude less than 5mm (0.5mV) [5 small boxes] | Present after every QRS Complex, upright, & uniform.
* Changes in some features may not categorize a rhythm from AF to something else and instead be mentioned after, such as: AF with RvR, AF with a LBBB, etc.
† Q-T Intervals are variable with HR, age, and sex.

Rates of AF
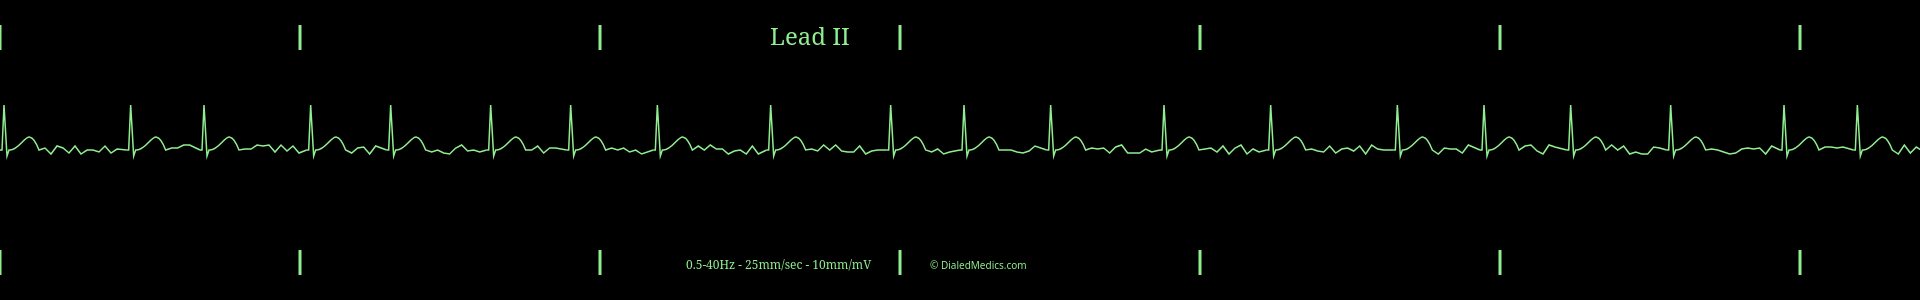
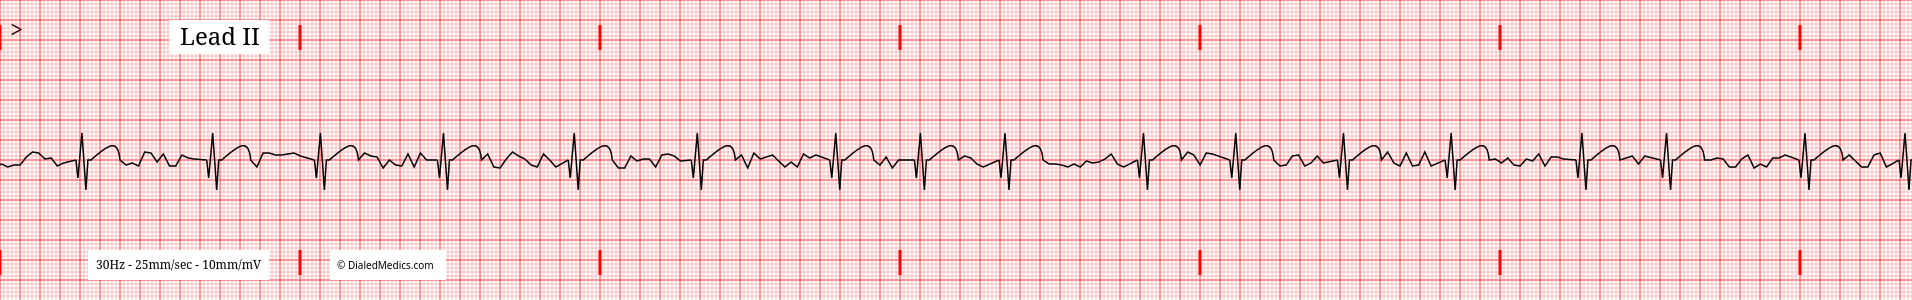
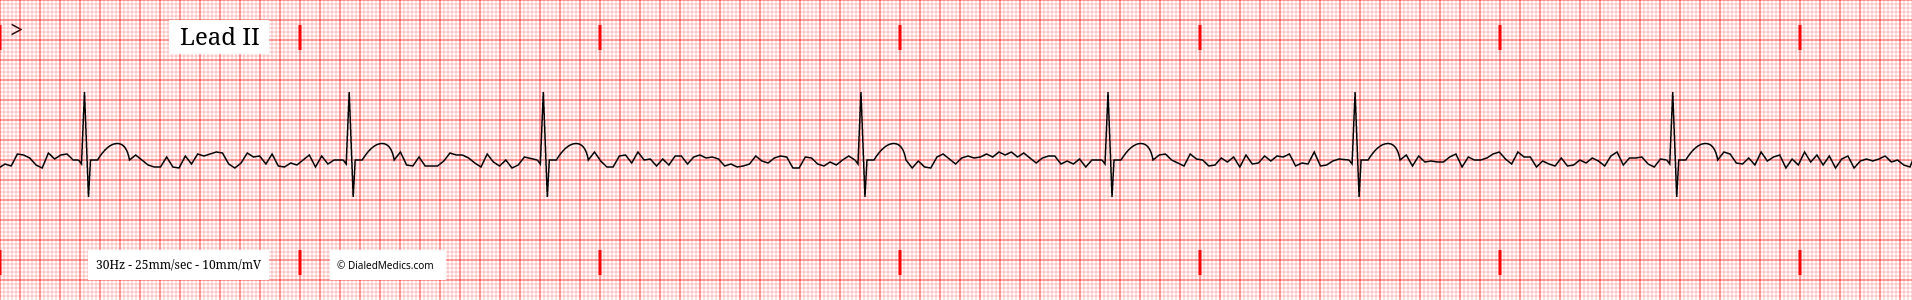
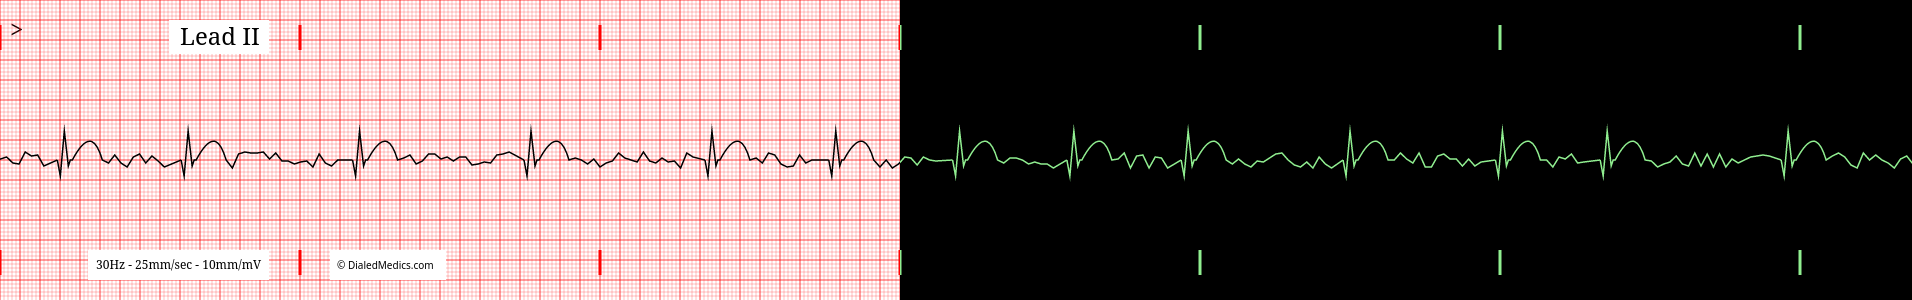
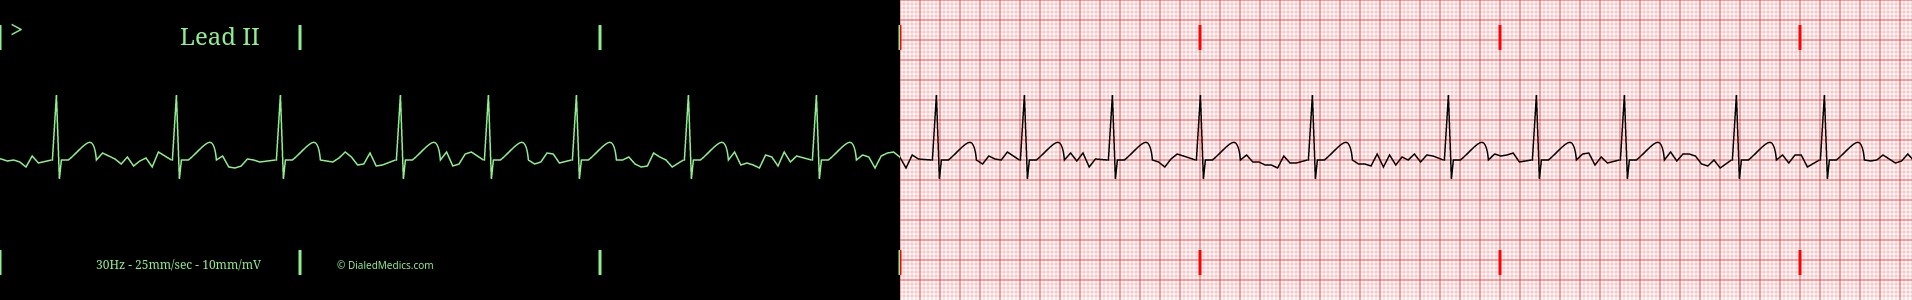
There is no explicit rate definition for Atrial Fibrillation. Instead, tachycardic rates (HR over 100) are called AF with a Rapid Ventricular Response while bradycardic rates (HR less than 60) are called AF with a Slow Ventricular Response. Below are examples of Atrial Fibrillation with a slow (top) and rapid (bottom) ventricular response, respectively.
Expected Rhythm of Atrial Fibrillation
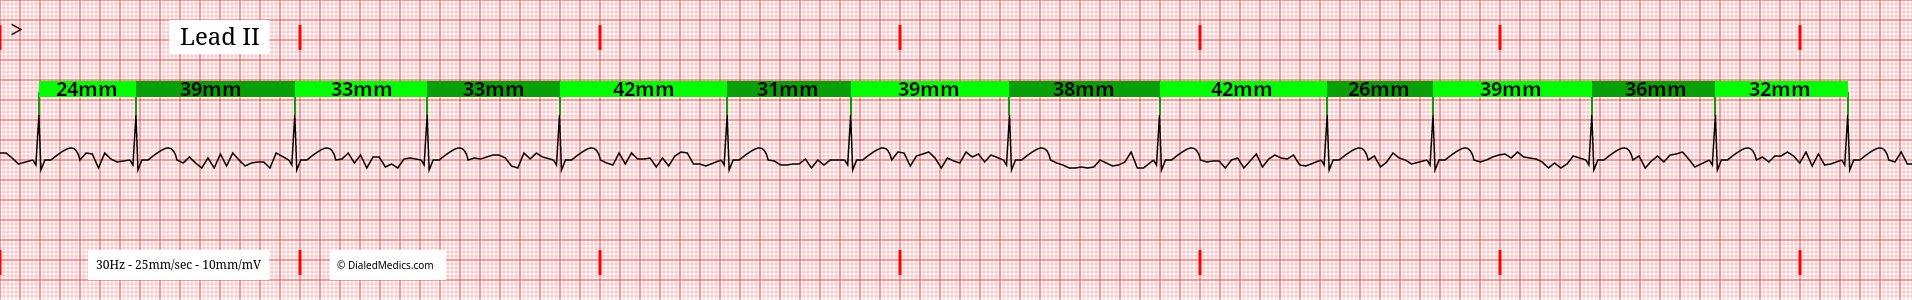
Atrial Fibrillation is an irregularly irregular rhythm. This means that it does not have a steady beat like a metronome (irregular) and it has no repeating pattern (irregularly irregular.) On the EKG this is visible with random R-R Intervals. Above is an example AF tracing with the random R-R Intervals marked in green.
Fibrillation waves in Atrial Fibrillation
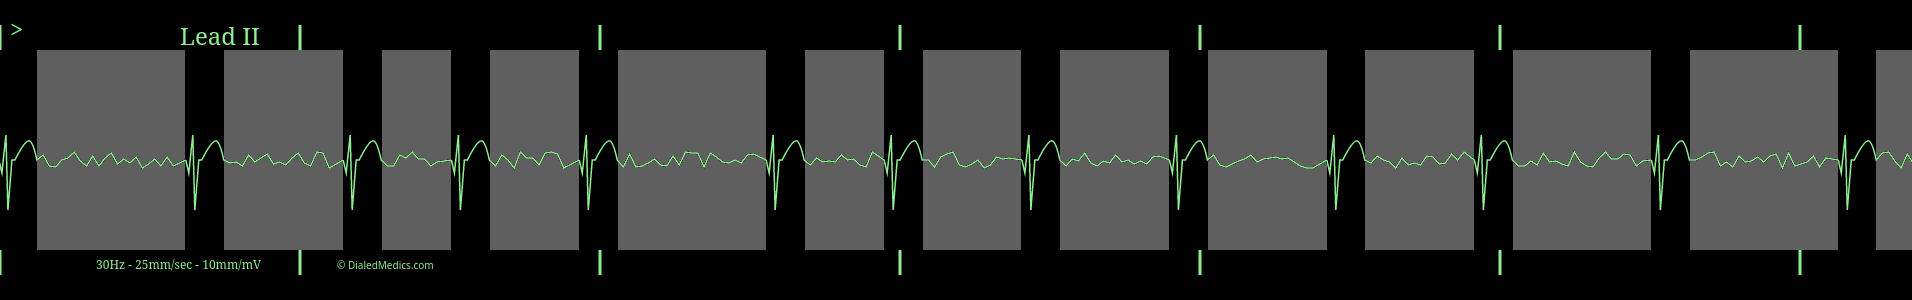
Fibrillation waves in Atrial Fibrillation are constant random deflections of both positive and negative amplitude. These waves are created by the chaotic and varied electrical signals that are fibrillation in the atria. As these random fibrillation waves activate the AV node, they are also responsible for the irregularly irregular ventricular rhythm described above. Below is a AF monitor capture with the segments of fibrillation marked in grey.
The QRS-T Segment in Atrial Fibrillation
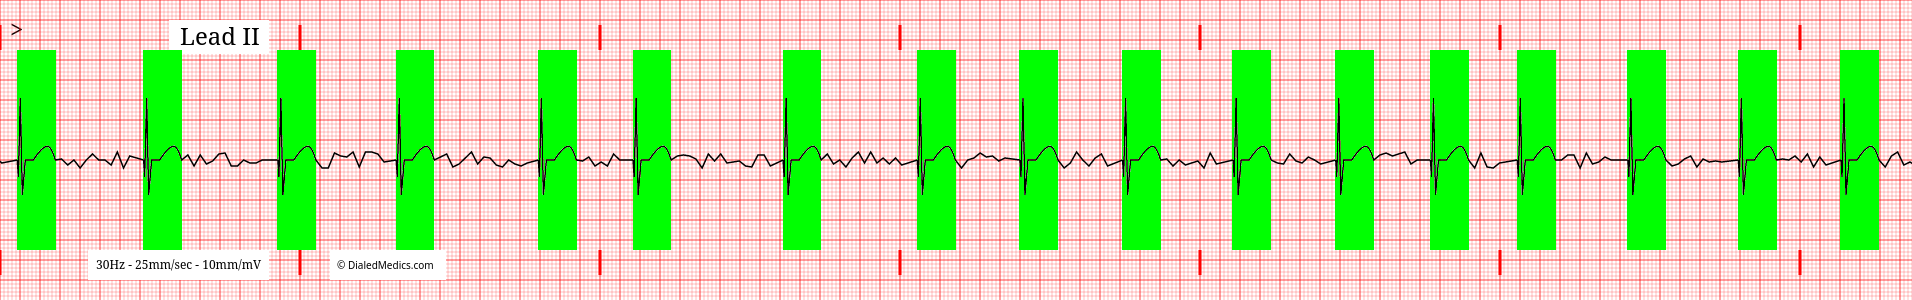
The QRS Complex and T Wave in AF should be of the expected morphology described in Normal Sinus Rhythm. Since the pathophysiology of Atrial Fibrillation is limited to the atria (superior to the AV Node) features on the EKG representing ventricular activation remain prototypical. The below example AF tracing has the QRS-T segment highlighted in green.
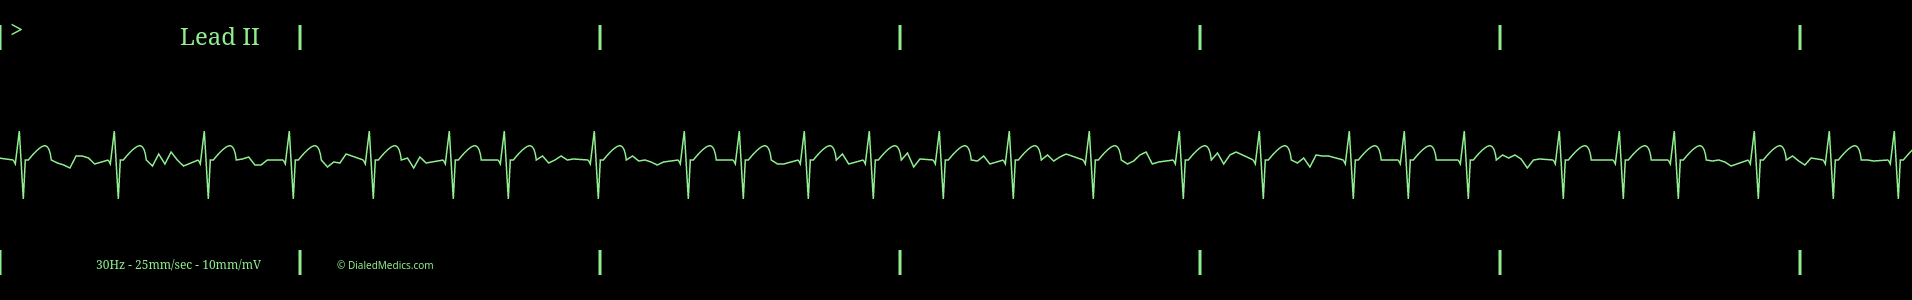
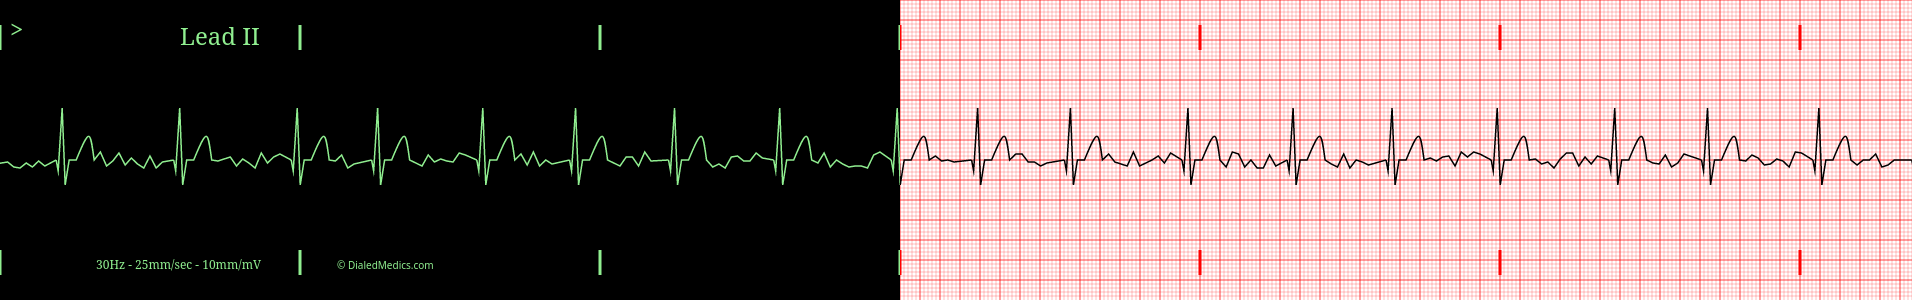
Below are several more examples of Atrial Fibrillation presented as monitor captures as well as on EGK graphs.
After becoming confident in identifying EKGs as Atrial Fibrillation head back to our EKG Rhythm Index to find information on another ECG. Otherwise practice interpreting novel EKGs with our EKG Generator:
Basic EKG App
Our Basic EKG Generator is free with an email signup and covers Normal Sinus Rhythm along with common arrhythmia.
Pro EKG App
Our Pro EKG Generator covers over 40 different rhythm categories, multiple display options, has Quiz and Simulation modes, and more! Try it out for just $5 for a month.